Case Study · OVERWATCH
Spatial Intelligence
Infrastructure.
No one was modeling neighborhood connectivity as infrastructure. So I built a system that does. OVERWATCH transforms raw RF signal data, WiFi, BLE and LoRa mesh, into a structured resilience model that answers one question: can this neighborhood function without the internet?
OVERWATCH grid live. Tracking aircraft via ADS-B, BLE devices, active mesh nodes, and cumulative wardriving scans. All layers updated in real time.
Origin
It started as a map. It became a model.
ScanMap was built to visualize wardriving data: upload WiFi and BLE scans, see signal density on a map, analyze mesh readiness. A technical instrument panel. Useful, but narrow.
The pivot happened when the analysis started generating real insight: mesh viability could be scored. Coverage gaps could be located precisely. Bridge nodes, the critical single points of failure, could be identified. Relay placement could be recommended algorithmically. AI could reason about local infrastructure from local data.
At that point, this wasn't a mapping tool anymore. It was a strategic planning engine for neighborhood-scale infrastructure resilience. Millions of scans processed. Dozens of live data layers. A formal scoring engine. ScanMap described what it did. OVERWATCH describes what it is.
Most neighborhood platforms assume connectivity. OVERWATCH measures it.
Evolution
Five phases. One through-line.
ScanMap
Wardrive upload and visualization. Map clustering. A technical instrument panel for WiFi and BLE signal density. Useful, but narrow.
Mesh Readiness
Viability scoring, coverage gap analysis, bridge node detection, relay placement modeling. The tool starts making recommendations, not just pictures.
OVERWATCH
Full infrastructure intelligence engine. Strategic planning dashboard. AI-assisted resilience assessment. Signals treated as environmental infrastructure, the same way you'd model roads or power lines.
Live Integration (Shipped)
Real-time JEEP-PI field sync at 5-second intervals. Incident alert layer: PROTEST, ICE, POLICE, ROAD, FIRE, MEDICAL, with 4-hour expiry. ADS-B aircraft tracking. AI Query Console: natural language to PostGIS SQL via Gemini. The platform became a live operational picture.
Multi-Domain Expansion (Shipped)
Global OSINT layers added: GDELT conflict events updated every 15 minutes, GDACS disaster alerts, USGS earthquakes, CelesTrak satellite TLE feeds, NASA FIRMS fire hotspots, NASA environmental imagery, feodotracker C2 nodes, IDOT camera grid. OVERWATCH became a full-spectrum intelligence platform.
Capabilities
What the intelligence engine actually does.
Neighborhood Readiness Index
A 0-100 composite score computed from four weighted metrics: BLE device density, mesh node coverage, WiFi relay potential, and signal quality. Named Meshtastic nodes are plotted individually. The WiGLE layer overlays crowd-sourced WiFi density on field-collected data. Coverage gap detection surfaces exactly where the network is thin, and relay placement recommendations tell you where hardware should go. Not an estimate. A score, with data behind it.
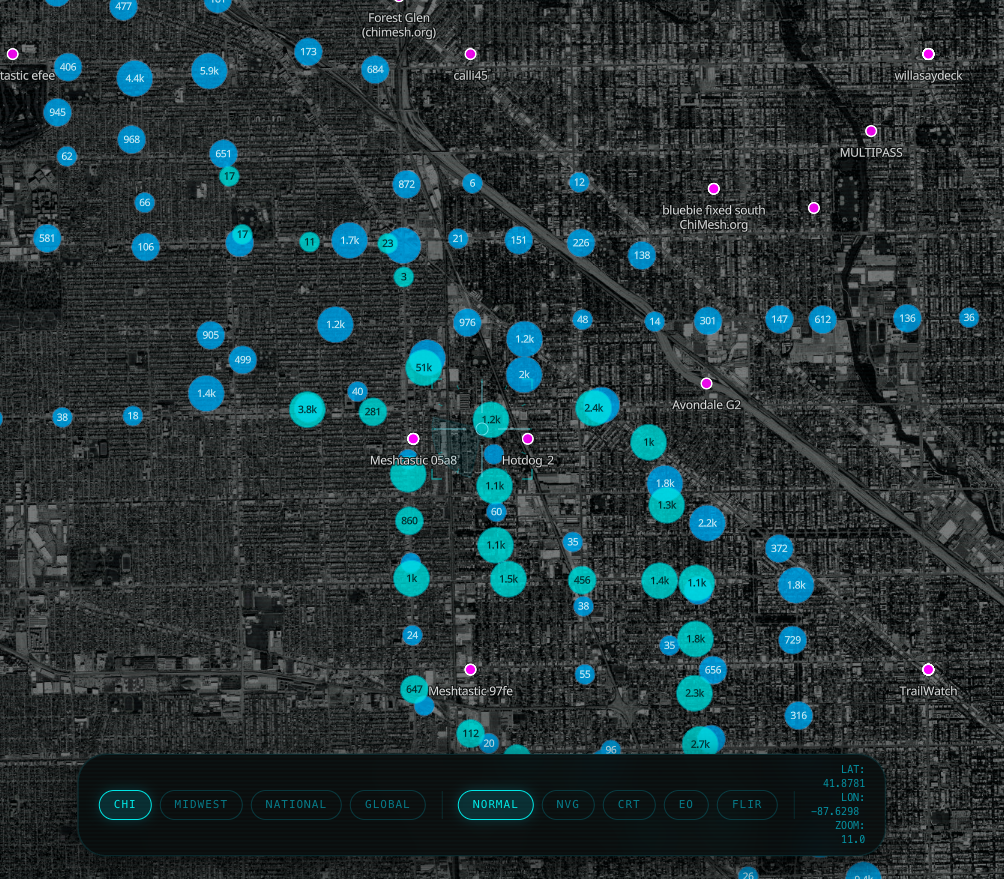
Chicago mesh intelligence grid: named LoRa nodes identified, signal clusters mapped by density, coverage gaps visible at a glance.
Live Data Layer System
Independently toggleable intelligence layers span every domain: live aircraft via ADS-B, global conflict events via GDELT updated every 15 minutes, natural disaster alerts via GDACS, earthquake data from USGS, cybersecurity C2 nodes from feodotracker, 500 CelesTrak satellite TLE feeds, NASA FIRMS fire hotspots, NASA GIBS environmental imagery, RainViewer weather radar, and local Chicago infrastructure layers including IDOT traffic cameras. Each layer is sourced, ingested, and rendered in real time. One interface. Every signal.
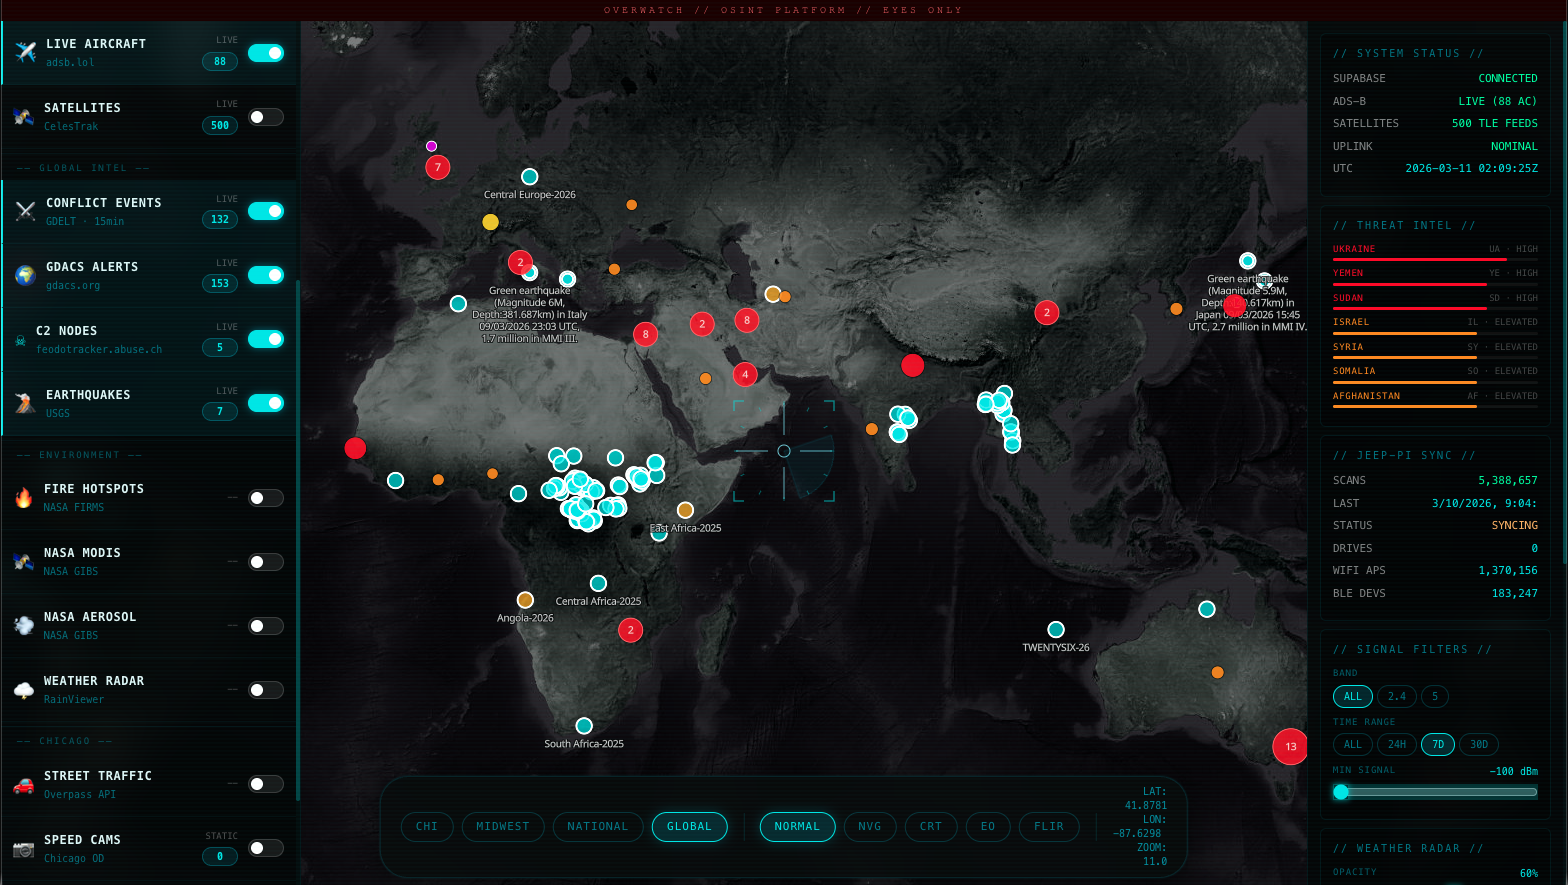
Global intelligence view: conflict events, disaster alerts, live aircraft, earthquake data, and C2 nodes. All active layers, single map.
System Status and Threat Intel
The platform maintains live health monitoring across every data source: Supabase connectivity, ADS-B aircraft feed status, satellite TLE ingestion, and JEEP-PI field sync uplinks. The threat intelligence panel shows country-level assessments at HIGH or ELEVATED classifications, updated continuously. Five tactical map rendering modes, NORMAL, NVG, CRT, EO, and FLIR, adapt the visual layer to mission context. Geographic presets (CHI, MIDWEST, NATIONAL, GLOBAL) snap the viewport to the relevant scale.
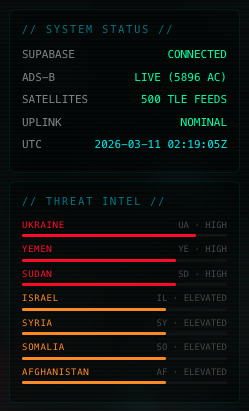
System status panel: live data source health, JEEP-PI uplink sync, and geopolitical threat classifications by country.
Mobile SIGINT Pipeline
JEEP-PI is a Raspberry Pi-based mobile scanner that syncs to OVERWATCH every 5 seconds. Field sessions ingest WiFi access points and BLE devices across real neighborhoods in real time. The signal filter panel slices by frequency band (2.4 GHz / 5 GHz), time window, and minimum signal strength in dBm. WiGLE integration overlays crowd-sourced WiFi density on top of live field collection. The result is a continuously growing, queryable dataset of physical RF infrastructure.
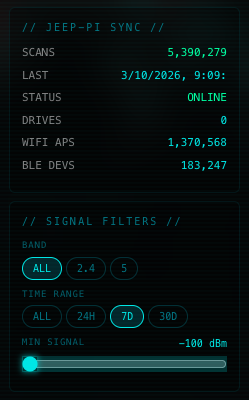
JEEP-PI sync: 5-second field polling feeding WiFi APs, BLE devices, and scan metadata into the intelligence layer continuously.
AI Query Console
Natural language queries translated directly to PostGIS SQL via Gemini, then executed against live scan data in Supabase. Type "show all BLE devices near downtown Chicago" and OVERWATCH generates the SQL, runs it, and returns results on the map. Queries target the observations, mesh_messages, and mesh_nodes tables. No pre-built filters, no dropdown menus. A direct intelligence interface to the underlying spatial database.
Multi-domain. Air, ground, signal, conflict, environment. A formal mesh viability scoring engine and natural language intelligence queries against live scan data. Applied spatial intelligence built to answer a real question.
Design Decisions
The thinking behind the system.
ScanMap Describes the Tool. OVERWATCH Describes What It Is.
The rename was not branding. ScanMap visualized signals. OVERWATCH models infrastructure resilience. When formal viability scoring, gap analysis, bridge node detection, and AI insights were in place, the original name was no longer accurate. The new name is.
Signals Are Infrastructure, Not Surveillance
The system ingests WiFi, BLE, and mesh signals without identity tracking, payload interception, or personal data collection. Signals are treated the same way you'd treat road data or power grid topology: as environmental infrastructure. That framing was designed in from day one.
AI Grounded in Local Scan Data
The AI query layer does not generate generic recommendations. It translates natural language directly to PostGIS SQL and executes it against the actual scan data for the actual area being analyzed. Relay suggestions, coverage queries, and infrastructure assessments run against what the field scanner found on the ground.
Infrastructure Awareness Before Coordination
OVERWATCH exists to answer one question before Trade Post asks you to rely on the mesh: can this neighborhood actually support it? Modeling resilience before building on it is the engineering discipline the rest of the Neighborhood OS depends on.
From Neighborhood Tool to Multi-Domain Platform
OVERWATCH started as a mesh readiness tool for one city. The expansion into global OSINT layers was not scope creep. It was the realization that local infrastructure resilience exists inside a larger threat context. Knowing a neighborhood can run mesh is more actionable when you also know what is happening in the air above it, the region around it, and the global conditions shaping it. Local and global are the same picture.
System Context
The intelligence spine of a larger system.
OVERWATCH does not stand alone. It is the intelligence layer of Neighborhood OS: the full stack that includes JEEP-PI (the physical mobile scanner hardware) and Trade Post (the coordination platform). The pipeline: JEEP-PI collects signals in the field, OVERWATCH models what those signals mean for infrastructure resilience, Trade Post uses that intelligence to route coordination through mesh when the grid fails.
OVERWATCH answers the question every other layer depends on: is this neighborhood ready to operate independently?
The Pipeline
JEEP-PI → OVERWATCH → Trade Post
Physical Collection → Intelligence Layer → Coordination Layer
Why It Matters
We built the internet. We never built a backup.
Every system we depend on, from emergency alerts to supply chains to the apps on your phone, assumes the internet is on. When it goes down, whether from a storm, a power failure, a cyberattack, or something nobody predicted, our ability to coordinate collapses with it. We have no visibility into what is actually happening around us. No situational awareness. No way to know what our neighbors know.
OVERWATCH is the answer to a question most people haven't thought to ask yet: what does the physical world around you look like, right now, without depending on the cloud to tell you?
It maps the invisible infrastructure that already exists in every neighborhood. The WiFi routers. The Bluetooth devices. The LoRa mesh radios. The aircraft overhead. The environmental and geopolitical conditions shaping the region. Combined, these signals tell a story about whether a place is connected, resilient, and ready, or dangerously dependent on systems it doesn't control.
This isn't a niche technical idea. It's the next layer of infrastructure awareness that cities, emergency planners, community organizers, and anyone who builds for the real world will eventually need. OVERWATCH builds that layer now.
The internet is not infrastructure. It is a service. OVERWATCH treats what is underneath it as infrastructure instead.
Intelligence Layers
20 signals. One picture.
Every layer is a live feed from a real data source. Toggle any combination. The map updates instantly.
WiFi Scatter
Every WiFi access point detected during wardriving sessions, plotted by exact location. Shows where wireless infrastructure actually lives.
BLE Devices
Bluetooth Low Energy devices detected in the field. Wearables, sensors, speakers, locks, anything broadcasting a BLE signal.
Mesh Nodes
Active LoRa mesh radio nodes from the Meshtastic network. Named devices plotted individually, showing the real topology of the off-grid communication layer.
JEEP-PI Live
Real-time position and scan feed from the mobile collection unit. Updates every 5 seconds while in the field.
WiGLE Networks
Crowd-sourced global WiFi database overlaid on field data. Adds density context from millions of publicly reported access points worldwide.
Live Aircraft
Every aircraft currently in the air, tracked via ADS-B transponder signals. Altitude, heading, speed, and flight ID in real time.
Satellites
500 active satellites tracked using orbital data from CelesTrak. Shows what is overhead at any given moment.
Conflict Events
Armed conflict incidents pulled from GDELT every 15 minutes. Sourced from global news media and mapped to precise locations.
Disaster Alerts
Natural disasters, industrial accidents, and humanitarian emergencies tracked via GDACS. Updated continuously from official international sources.
C2 Nodes
Active cybersecurity threat infrastructure: command-and-control servers used by malware and botnets, sourced from feodotracker. Shows where active cyberattacks are being coordinated from.
Earthquakes
Seismic events globally, sourced from USGS in real time. Magnitude, depth, and affected population radius.
Fire Hotspots
Active wildfire and burn detections from NASA FIRMS satellite imagery. Updated multiple times daily.
NASA MODIS
True-color and false-color satellite imagery from NASA. Shows ground conditions, smoke, flooding, and land change from orbit.
NASA Aerosol
Atmospheric aerosol density from NASA satellites. Tracks smoke, dust, and air quality conditions at regional scale.
Weather Radar
Live precipitation radar from RainViewer. Real-time storm tracking with adjustable opacity over any map layer.
Street Traffic
Live traffic conditions on Chicago roads from OpenStreetMap. Congestion, closures, and flow rate.
Speed Cameras
All City of Chicago speed enforcement camera locations from the open data portal. Static layer showing the full enforcement grid.
Incidents
Community-reported alerts: protests, police activity, road closures, fires, and medical events. User-generated, expire after 4 hours.
Sun Calc
Right-click anywhere on the map to get precise sunrise, sunset, golden hour, and solar position for that location and date.
Mapillary
Street-level photography layer. Click any mapped road to see what it actually looks like on the ground.
The Takeaway
A new kind of map. Built for what's coming.
OVERWATCH is what happens when you stop treating the internet as a given and start asking what you'd know without it. It is a working system, deployed and live, that combines field-collected signal data with real-time global intelligence feeds into a single coherent picture. No guesswork. No assumptions. Just what the world actually looks like, right now.
This kind of spatial intelligence platform has obvious applications far beyond the original use case: emergency management, urban planning, community resilience, journalism, security research, and anywhere situational awareness matters more than a Google Maps pin.
Not a wardriving tool. A new category of infrastructure awareness.